


Table of Contents
Differences between Burndown and Burnup Charts
Definition of Burnup Chart
A Burnup Chart is a project management tool used to track progress and display the total amount of work completed in a project, as well as the total scope of work. It shows the cumulative progress of a project, including both completed and remaining work, and is used to monitor progress and identify potential roadblocks.
Definition of Burndown Chart
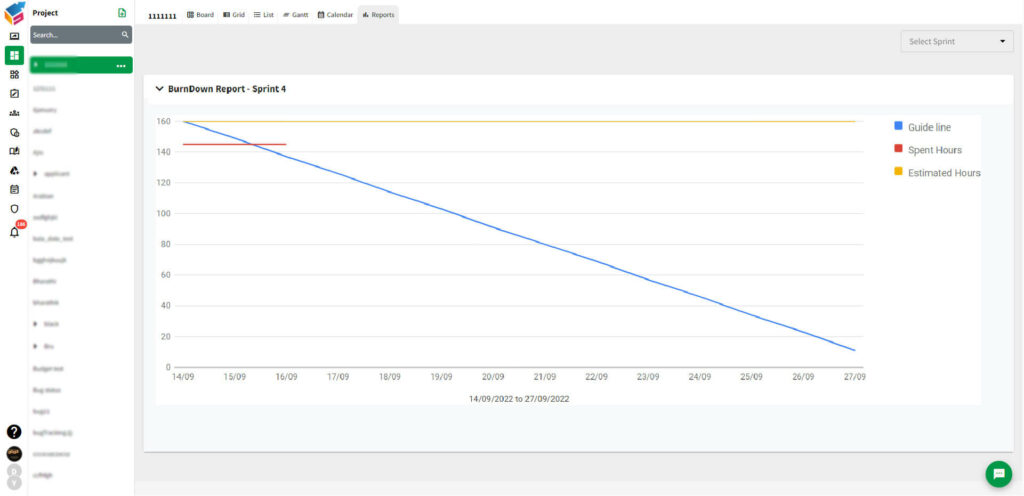
A Burndown Chart is a graphical representation of the amount of work remaining in a project over time. It helps project managers track progress towards completing tasks and reaching project goals, by showing how much work has been completed and how much remains.
Key Differences
The key differences between Burnup and Burndown Charts are:
- Purpose: A Burnup Chart is used to track the total amount of work completed in a project, including both completed and remaining work. A Burndown Chart is used to track the amount of work remaining in a project over time.
- Information displayed: A Burnup Chart displays the cumulative progress of a project, including both completed and remaining work. A Burndown Chart shows only the remaining work.
- Use: Burnup Charts are used to monitor progress and identify potential roadblocks. Burndown Charts are used to track progress towards completing tasks and reaching project goals.
- Flexibility: Burnup Charts are more flexible, as they can accommodate changes in scope. Burndown Charts are less flexible, as they only track work that has been defined at the start of a project.
Setting up a Burndown Chart
To set up a Burndown Chart, follow these steps:
- Identify the tasks and deliverables of your project: Create a list of all tasks and deliverables that need to be completed in order to reach your project goals.
- Establish a timeline: Determine the start and end dates for your project and create a timeline for each task.
- Assign task estimates: Estimate the amount of time each task will take to complete.
- Plot the data: Plot the estimated time for each task on a graph, with the horizontal axis representing time and the vertical axis representing work remaining.
- Track progress: As tasks are completed, update the chart with the actual time taken.
- Monitor the trend: Observe the trend of the chart to see if the project is on track to meet its deadlines and identify any potential roadblocks.
- Review and adjust: Regularly review the chart and adjust the estimates for remaining tasks if necessary.
Your Burndown Chart should now accurately reflect the progress of your project, and help you stay on track towards your project goals.
Setting up a Burnup Chart
To set up a Burnup Chart, follow these steps:
- Identify the scope of the project: Determine the total amount of work that needs to be completed in order to reach your project goals.
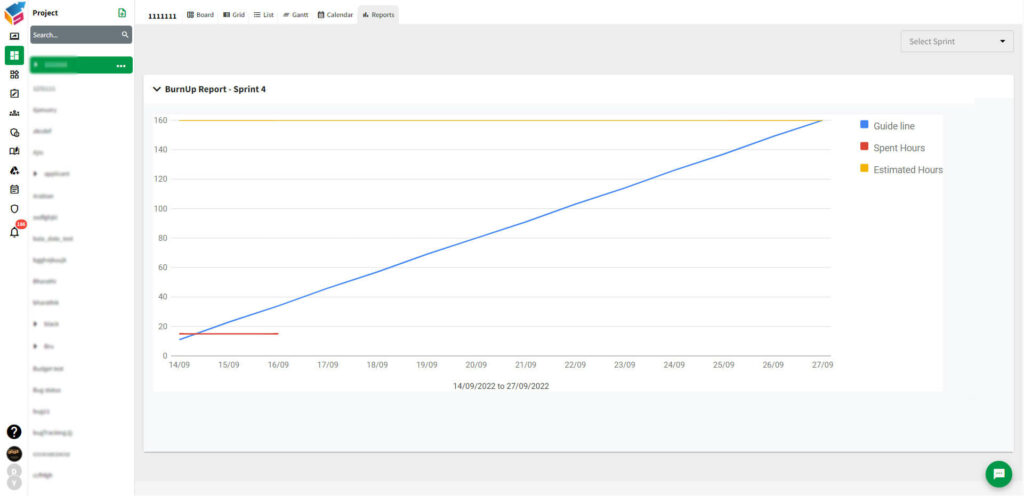
- Plot the data: Plot the total scope of work on a graph, with the horizontal axis representing time and the vertical axis representing work completed and work remaining.
- Track progress: As tasks are completed, update the chart with the actual amount of work completed.
- Monitor the trend: Observe the trend of the chart to see if the project is on track to meet its goals, and identify any potential roadblocks.
- Review and adjust: Regularly review the chart and adjust the estimates for remaining work if necessary.
Your Burnup Chart should now accurately reflect the progress of your project, and help you monitor the total amount of work completed and work remaining, as well as track your progress towards project goals.
Summary of Differences and Uses
The key differences between burndown vs burnup are their purpose, the information they display, and their level of flexibility.
Burnup Charts are used to monitor progress and display the total amount of work completed in a project, including both completed and remaining work. They are more flexible and can accommodate changes in scope.
Burndown Charts, on the other hand, are used to track progress towards completing tasks and reaching project goals, and display only the amount of work remaining. They are less flexible and can only track work that has been defined at the start of a project.
In summary, both Burnup and Burndown Charts are project management tools used to track progress and display information about a project. The choice of which to use depends on the specific needs and goals of a project.
Recommendations for Choosing the Right Chart
When choosing between Burnup and Burndown Charts, consider the following factors:
- Project goals: Consider the specific goals of your project and what kind of information you need to track in order to achieve them.
- Flexibility: Consider how much the scope of your project may change, and whether a Burnup Chart, which is more flexible, may be more appropriate.
- Accuracy: Consider the level of accuracy you need in tracking progress. Burndown Charts, which only track work that has been defined at the start of a project, may be more accurate, while Burnup Charts, which track all work, including any changes to the scope, may be less accurate.
- Ease of use: Consider how easy it is to set up and use each type of chart, as well as how easy it is to understand the information displayed.
Ultimately, the choice between Burnup and Burndown Charts in project management depends on the specific needs and goals of a project. It may be helpful to use both charts and compare the information they display in order to make the best decision.
Final Thoughts
In conclusion, burndown chart vs burnup chart are important project methodologies that can help you track progress and display information about a project timeline. When choosing between the two project methodologies, consider the specific goals of your project, the level of flexibility and accuracy you need, and the ease of use of each chart.
It is important to regularly review and update these charts using project management tool in order to accurately reflect the progress of your project. Used effectively, Burnup and Burndown Charts can help you stay on track towards meeting your project goals and deliver a successful outcome.