


Software-as-a-Service (SaaS) application have become integral to businesses across various industries. Whether you’re a SaaS product owner, a product manager, or a data analyst, understanding how your app analytics platforms perform and how users interact with it is crucial for making informed decisions and driving growth.
In this guide, we will explore a wide range of tools, tips, and key metrics that will empower you to track and measure the performance of your SaaS app effectively. By leveraging these insights, you can gain a deeper understanding of user behavior, identify areas for improvement, and optimize your app’s performance to enhance user satisfaction and drive business success.
Throughout this guide, we will delve into the various tools available for tracking SaaS app analytics, ranging from powerful data analytics platforms to specialized tools for user behavior analysis. We will discuss their features, benefits, and provide recommendations based on different use cases and budget considerations.
Whether you’re a beginner seeking a solid foundation in SaaS app analytics or an experienced professional looking to refine your tracking strategies, this comprehensive guide has something for everyone.
So, let’s dive in and discover the tools, tips, and key metrics that will help you unlock the full potential of your SaaS app and drive it towards greater success.
SaaS app analytics: What is it and why is it important?
SaaS app analytics is the practice of collecting and analyzing data related to the usage and performance of a Software-as-a-Service (SaaS) application. It involves tracking various metrics and user interactions within the application to gain insights into its usage patterns, user behavior, and overall performance.
There are several reasons why SaaS app analytics is important:
- User Behavior Understanding: Analytics provides valuable insights into how users interact with the application. It helps identify which features are most popular, which workflows are frequently used, and how users navigate through the application. This understanding allows product teams to make data-driven decisions to improve the user experience and optimize the application’s design.
- Product Improvement: Analytics helps identify areas of improvement within the SaaS application. By analyzing user behavior and usage patterns, product teams can identify pain points, bottlenecks, or features that are underutilized. This information enables them to prioritize development efforts, make informed decisions on feature enhancements, and deliver a better product that meets the needs of the users.
- Performance Monitoring: SaaS app analytics provides visibility into the performance of the application. It tracks metrics such as response times, error rates, and system uptime. By monitoring these metrics, product teams can diagnose performance issues, identify bottlenecks, and optimize the application’s infrastructure to ensure a smooth and reliable user experience.
- Customer Success and Retention: Analytics can help improve customer success and retention rates. By tracking user engagement metrics, such as user adoption, feature usage, and customer satisfaction, businesses can identify users who may be at risk of churn or those who may benefit from additional support or training. This allows customer success teams to proactively engage with customers, help, and drive user satisfaction and loyalty.
- Data-Driven Decision Making: SaaS mobile app analytics provides objective data that can drive strategic decision making. By analyzing user behavior, product teams can validate hypotheses, measure the impact of changes or new features, and make informed decisions based on real user data rather than relying solely on assumptions or intuition.
Overall, SaaS app analytics plays a crucial role in understanding user behavior, improving the product, optimizing performance, ensuring customer success, and making data-driven decisions. It empowers SaaS businesses to deliver a better user experience, increase customer satisfaction, and drive business growth.
4 app usage metrics to track and why are they important
There are numerous app usage metrics that can be tracked, but here are four important ones and why they are significant:
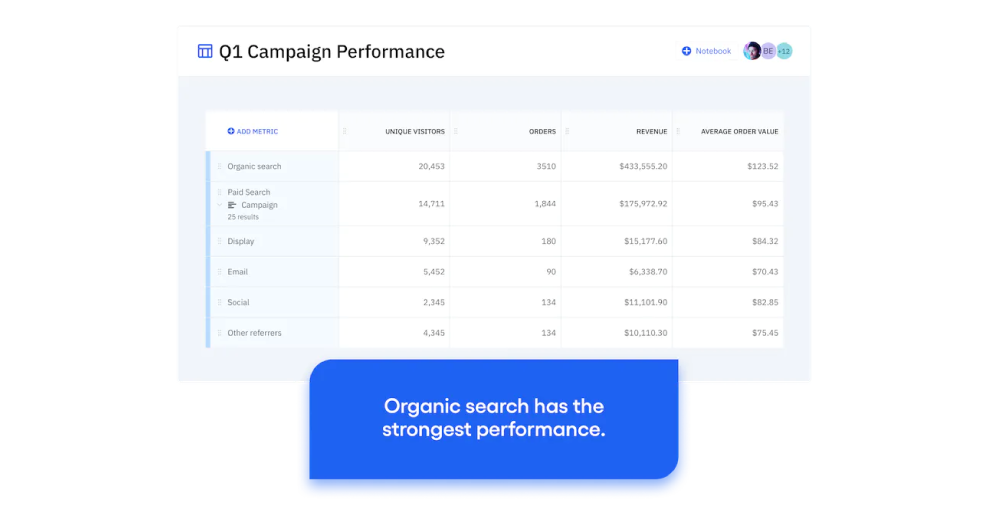
- Active Users: This metric measures the number of unique users who actively engage with the app within a specific period, such as daily or monthly active users (DAU/MAU). Tracking active users provides an understanding of the app’s popularity and adoption rate. It helps assess the app’s overall reach, user engagement, and the effectiveness of marketing campaigns. By monitoring active users over time, businesses can identify trends, measure user retention, and make informed decisions to improve user acquisition and retention strategies.
- Session Length and Frequency: Session length measures the average time users spend within a single session of app usage, while session frequency tracks how often users return to the app. These metrics provide insights into user engagement and the stickiness of the app. Longer session lengths and frequent usage indicate higher user satisfaction and involvement. On the other hand, short session lengths or infrequent usage may indicate user dissatisfaction or a lack of compelling features. By monitoring these metrics, businesses can identify opportunities for improving user engagement, identifying popular features, and increasing the overall app usage.
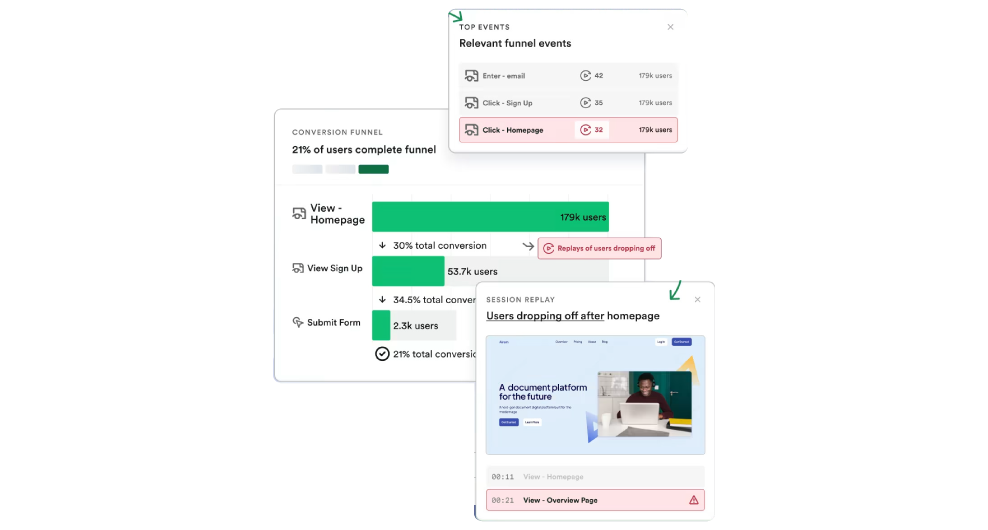
- Conversion Funnel: The conversion funnel represents the user journey from initial app installation or signup to desired actions, such as making a purchase, subscribing to a plan, or completing a specific task. Tracking the conversion funnel helps identify potential drop-off points or areas of improvement within the user flow. By analyzing the conversion rates at each step, businesses can optimize the user experience, remove friction points, and increase conversion rates. It provides valuable insights into user behavior and highlights areas where users may face challenges or abandon the app.
- Churn Rate: Churn rate refers to the percentage of users who stop using the app within a given period. Tracking churn rate is crucial for understanding user retention and the health of the user base. A high churn rate indicates dissatisfaction, lack of value, or poor user experience, which can be detrimental to the growth and success of a SaaS app. By identifying the reasons for churn, businesses can take proactive measures to address user concerns, improve the app, and implement strategies to reduce churn. Tracking churn rate allows businesses to focus on customer retention and engagement, leading to increased customer lifetime value and sustainable growth.
These app usage metrics provide valuable insights into user behavior, engagement, retention, and overall app performance. By monitoring and analyzing these metrics, businesses can make data-driven decisions, improve the user experience, optimize marketing efforts, and drive business growth.
What tools can you use to track SaaS app metrics?
There are several tools available that can help track SaaS app metrics. Here are some commonly used tools:
Google Analytics
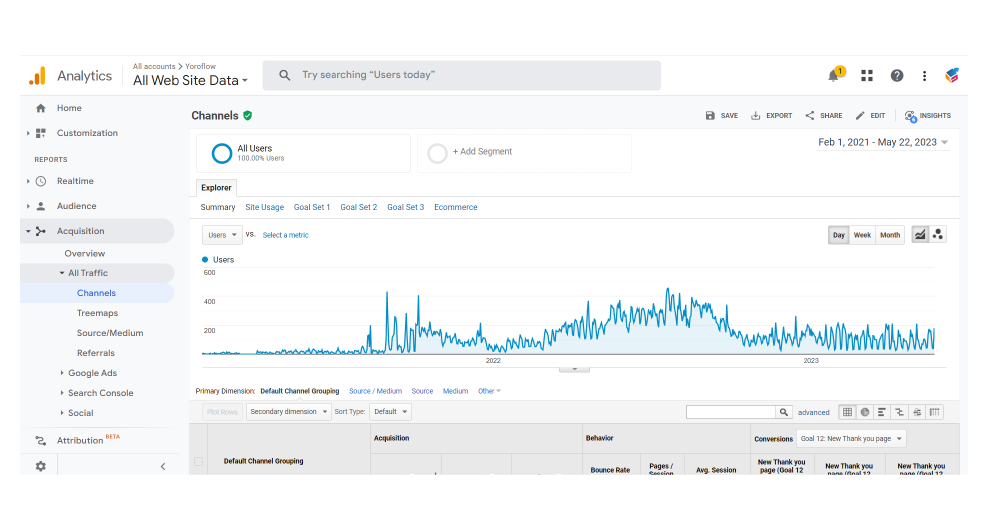
Google Analytics is a popular and powerful web analytics tool that can be used to track various metrics related to SaaS app usage. It provides insights into user behavior, acquisition channels, conversion rates, and more. By integrating the Google Analytics tracking code into your app, you can collect and analyze data to gain valuable insights.
Mixpanel
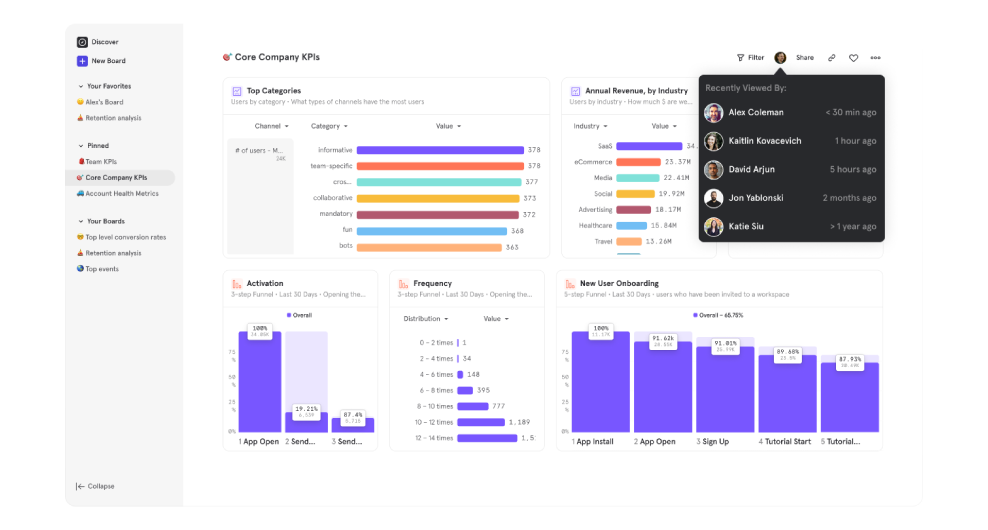
Mixpanel is an analytics platform specifically designed for mobile and web applications. It offers features for tracking user events, funnels, retention, and user segmentation. Mixpanel provides a user-friendly interface and advanced analytics capabilities to understand user behavior, engagement, and conversion rates.
Amplitude
Amplitude is another analytics platform focused on tracking user behavior in applications. It allows you to collect and analyze data on user actions, retention, funnels, and cohorts. Amplitude offers features like behavioral cohort analysis, user segmentation, and A/B testing to help you understand and optimize your app’s performance.
Heap Analytics
Heap Analytics is a tool that automatically captures user interactions and events in your app without the need for manual event tracking. It provides a comprehensive view of user behavior, conversion funnels, and user retention. Heap Analytics also offers features like retroactive event tracking, user segmentation, and funnel analysis.
Kissmetrics

Kissmetrics is an analytics platform that focuses on customer behavior and engagement. It provides insights into user actions, conversion rates, customer lifetime value, and cohort analysis. Kissmetrics offers features to track events, create funnels, and segment users based on their behavior.
Segment
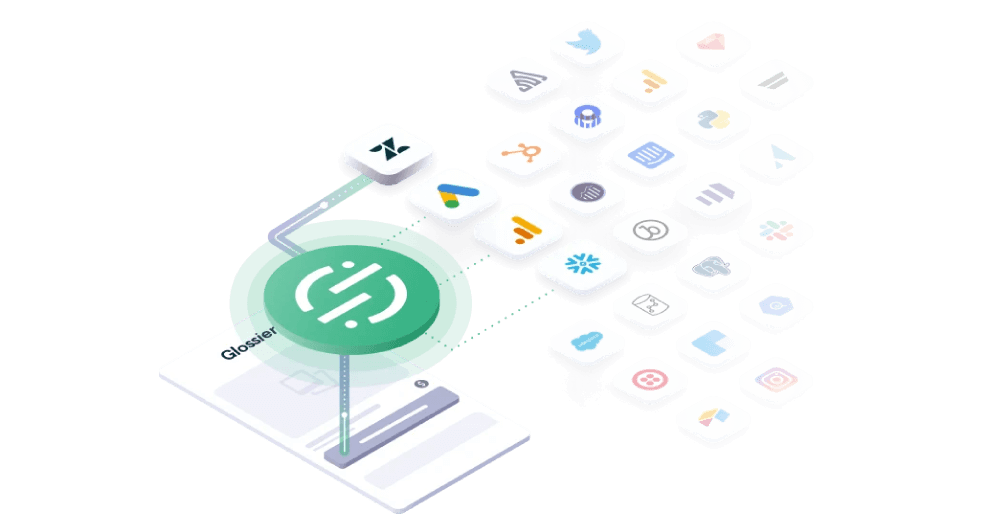
Segment is not strictly a metric tool itself, but rather a customer data platform that integrates with various analytics tools. It allows you to collect and send data to multiple analytics platforms, including Google Analytics, Mixpanel, Amplitude, and more. Segment simplifies the process of implementing and managing analytics tracking within your app.
These tools provide different features and capabilities for tracking SaaS app metrics. The choice of tool depends on your specific needs, the complexity of your app, and the level of analytics sophistication you require. It’s important to evaluate the features, pricing, ease of integration, and scalability of each tool before planning.
How to implement SaaS app analytics tools on your app
To implement SaaS app analytics tools on your app, you can follow these steps. First, select an analytics tool that aligns with your requirements, such as Google Analytics, Mixpanel, or Amplitude. Next, review the documentation or guides provided by the analytics tool to understand the implementation process.
Typically, you’ll need to add the analytics tracking code or SDK to your app. This code will track user events, actions, and other metrics. Depending on the analytics tool, you may also need to configure additional settings or enable specific features. Once the implementation is complete, you can start collecting data and accessing analytics reports through the analytics tool’s interface.
Remember to review and update your app’s privacy policy and terms of service to inform users about the data being collected. Regularly analyze the gathered data to gain insights, improve user experience, and make data-driven decisions to enhance your app.