


Table of Contents
In today’s data-driven era, understanding and effectively communicating information is paramount, and data visualization plays a crucial role in making complex data accessible and actionable.
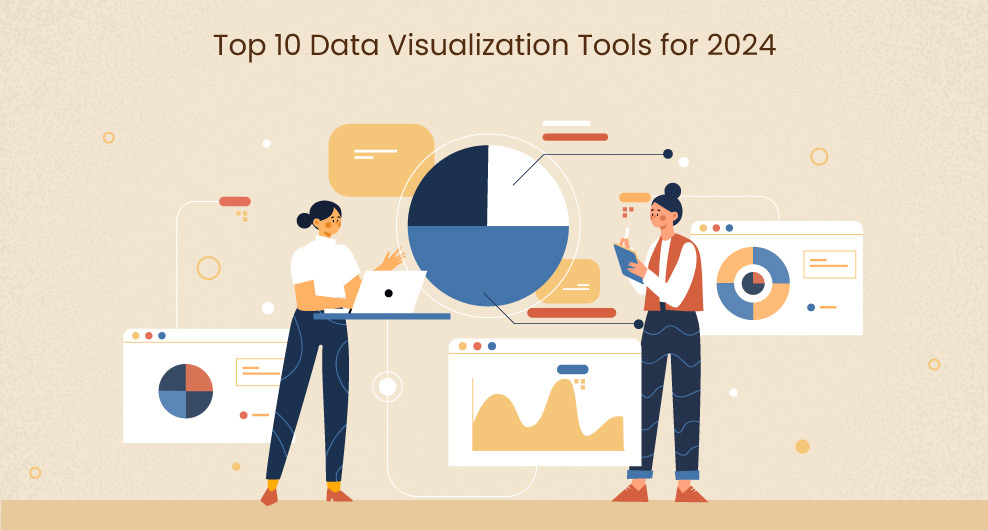
As the volume and complexity of data continue to grow exponentially, data visualization tools have become essential for businesses, analysts, and individuals alike. These tools empower us to unlock hidden insights, discover patterns, and tell compelling stories through visually engaging charts, graphs, and interactive dashboards.
In this blog, we will take a closer look at the cutting-edge data visualization tools that are leading the charge in 2023.
Let’s dive in and uncover the tools that will shape the future of visual data storytelling!
Overview of data visualization
Data visualization is the practice of representing data in a visual or graphical format, making complex information more accessible, understandable, and visually appealing. It involves the use of charts, graphs, maps, and other visual elements to present data patterns, trends, and relationships.
The main purpose of data visualization is to communicate insights and stories hidden within large and complex datasets. By visually representing data, it becomes easier for individuals to comprehend and analyze information, identify patterns, draw conclusions, and make data-driven decisions.
Data visualization plays a crucial role in various fields and industries, including business, finance, marketing, healthcare, science, and more. It enables professionals to explore and interpret data, communicate findings to stakeholders, and support decision-making processes.
There are several key benefits to using data visualization:
- Simplifies complexity: Visual representations simplify complex data by condensing it into easily digestible formats. This helps users grasp trends, correlations, and outliers quickly.
- Enhances understanding: By presenting data visually, patterns and relationships can be more readily understood, enabling better comprehension of the underlying information.
- Enables insights and discoveries: Data visualization can reveal hidden insights and discoveries that might not be apparent in raw data. By visualizing data, unexpected patterns or trends can emerge, leading to new discoveries and opportunities.
- Facilitates storytelling: Visualizations help tell compelling stories with data, making it easier to communicate findings, engage audiences, and influence decision-making.
- Supports data exploration: Interactive visualizations allow users to explore data from different angles, zoom in on specific details, and filter information based on specific criteria, providing a deeper understanding of the dataset.
To create effective data visualizations, it’s important to choose the right visualization techniques and tools based on the nature of the data and the objectives of the analysis. With a wide range of data visualization tools available today, individuals can create stunning visualizations with varying levels of complexity, customization, and interactivity, empowering them to unlock the full potential of their data.
Why are data visualization tools important?
Data visualization tools are important for several reasons:
- Enhanced Data Comprehension: Data visualization tools help in transforming complex and abstract data into visual representations such as charts, graphs, and maps. Visualizations make it easier for individuals to comprehend large volumes of data, identify patterns, trends, and outliers, and understand the relationships between different data points. Visual representations simplify the understanding of complex data sets, enabling users to extract valuable insights quickly.
- Effective Communication: Data visualizations enable effective communication of information. Visual representations have a greater impact on the human brain compared to raw data or textual information. By presenting data in visually appealing and engaging formats, data visualization tools facilitate the communication of key findings, analysis, and insights to stakeholders, colleagues, or clients. Visualizations can tell compelling stories, make data-driven arguments, and influence decision-making processes.
- Decision-Making Support: Data visualization tools provide valuable support in the decision-making process. By visualizing data, decision-makers can gain a holistic view of the information, understand trends and correlations, and make informed decisions. Visualizations help in identifying patterns, outliers, and trends that may not be apparent in raw data, leading to better decision-making and strategic planning.
- Exploratory Data Analysis: Data visualization tools facilitate exploratory data analysis, allowing users to interactively explore data, drill down into specific details, and gain a deeper understanding of the dataset. Interactive visualizations enable users to filter, sort, and manipulate data in real-time, uncovering new insights and generating hypotheses. These tools empower users to ask questions of the data, test hypotheses, and discover hidden patterns or relationships.
- Collaboration and Sharing: Data visualization tools enable collaboration and sharing of insights. They allow users to create interactive dashboards, reports, or visual presentations that can be shared with colleagues, teams, or clients. By providing a common visual language, these tools foster collaboration, facilitate discussions, and align stakeholders around the data-driven insights. Collaborative features enable multiple users to work on the same visualizations simultaneously, ensuring efficient teamwork and knowledge sharing.
- Data-Driven Storytelling: Data visualization tools support data-driven storytelling. They help in presenting data in a narrative format, combining visual elements with contextual information, annotations, and annotations. By leveraging visualizations, users can craft compelling narratives around their data, engage audiences, and effectively convey the significance and implications of the insights. Visual storytelling makes data more memorable, engaging, and impactful.
Data visualization tools are essential in transforming data into actionable insights. They facilitate data comprehension, enable effective communication, support decision-making, empower exploratory analysis, foster collaboration, and enhance data-driven storytelling. By harnessing the power of visual representations, these tools empower individuals and organizations to unlock the full potential of their data and drive meaningful outcomes.
Top 10 data visualization tools
- Yoroproject: Yoroproject is a powerful and widely used project management tool that offers a comprehensive suite of features for creating interactive dashboards, charts, and reports. It provides a user-friendly interface, project dashboard, drag-and-drop form builder, workflow builder, and project management templates and supports data integration from various sources.
- Power BI: Microsoft Power BI is a popular tool for data visualization and business intelligence. It enables users to create dynamic visualizations, interactive dashboards, and reports. Power BI integrates well with other Microsoft products and supports data exploration and collaboration.
- QlikView: QlikView is known for its associative data model, which allows users to explore data intuitively and dynamically. It offers drag-and-drop functionality, powerful visualization options, and robust data integration capabilities.
- D3.js: D3.js is a JavaScript library that provides a high level of flexibility and customization for creating interactive and dynamic data visualizations on the web. It offers a wide range of visualization options and is widely used for creating custom visualizations.
- Tableau Public: Tableau Public is a free version of Tableau that allows users to create and share interactive data visualizations on the web. It offers a user-friendly interface and is ideal for individuals and organizations looking to publish visualizations for public consumption.
- Google Data Studio: Google Data Studio is a web-based data visualization and reporting tool. It integrates seamlessly with other Google products, such as Google Analytics, and provides a range of visualization options and collaboration features.
- Plotly: Plotly is a versatile data visualization library available in various programming languages, including Python, R, and JavaScript. It offers interactive charts, graphs, and dashboards, making it suitable for both exploratory analysis and production-level visualizations.
- Looker: Looker is a data visualization and business intelligence platform that focuses on collaborative analytics. It allows users to create and share interactive visualizations, explore data, and gain insights through a user-friendly interface.
- SAP Analytics Cloud: SAP Analytics Cloud combines business intelligence, planning, and predictive analytics capabilities with data visualization. It offers interactive dashboards, smart insights, and seamless integration with SAP’s ecosystem.
- ggplot2: ggplot2 is an R package that provides a powerful grammar of graphics for creating static and publication-quality visualizations. It offers a wide range of customization options and is highly extensible.
These top 10 data visualization tools for 2023 represent a diverse selection of tools that cater to different needs, skill levels, and data requirements. Whether you’re a beginner or an advanced user, these tools can help you transform raw data into meaningful and impactful visualizations.
Conclusion
In conclusion, the world of data visualization is constantly evolving, and as we enter 2023, it’s crucial to stay updated with the top tools that can transform your data into impactful visualizations. The top 10 data visualization tools for 2023 presented in this blog offer a wide range of features, functionalities, and customization options to cater to diverse user needs.
From established leaders like Yoroproject and Power BI to innovative offerings like D3.js and Plotly, these tools empower individuals and organizations to unlock the true potential of their data. They simplify complex data, enhance understanding, and facilitate effective communication of insights to stakeholders.
The selection of the right tool depends on your specific requirements, such as ease of use, scalability, integration capabilities, and visualization types. Consider factors like the nature of your data, your technical expertise, and the level of customization needed to choose the tool that best fits your needs.
Embrace the power of data visualization and embark on a journey to transform your data into compelling visual narratives that drive meaningful impact in this data-driven era. Stay curious, explore the possibilities, and make the most of these cutting-edge data visualization tools in 2023 and beyond.